The Bizarre Figures of Venezuela’s Economic Recovery
The Venezuelan Central Bank started publishing some numbers after years of total opacity, and some foreign institutions are projecting growth that to Venezuelans seems otherwordly
What’s the truth about the current state of Venezuela’s economy and which predictions about 2022 make sense?
In March, the monthly inflation rate released by the Banco Central de Venezuela (BCV) was 1.4%, but according to the Observatorio Venezolano de Finanzas (OVF), it was 10.5%, almost eight times as much.
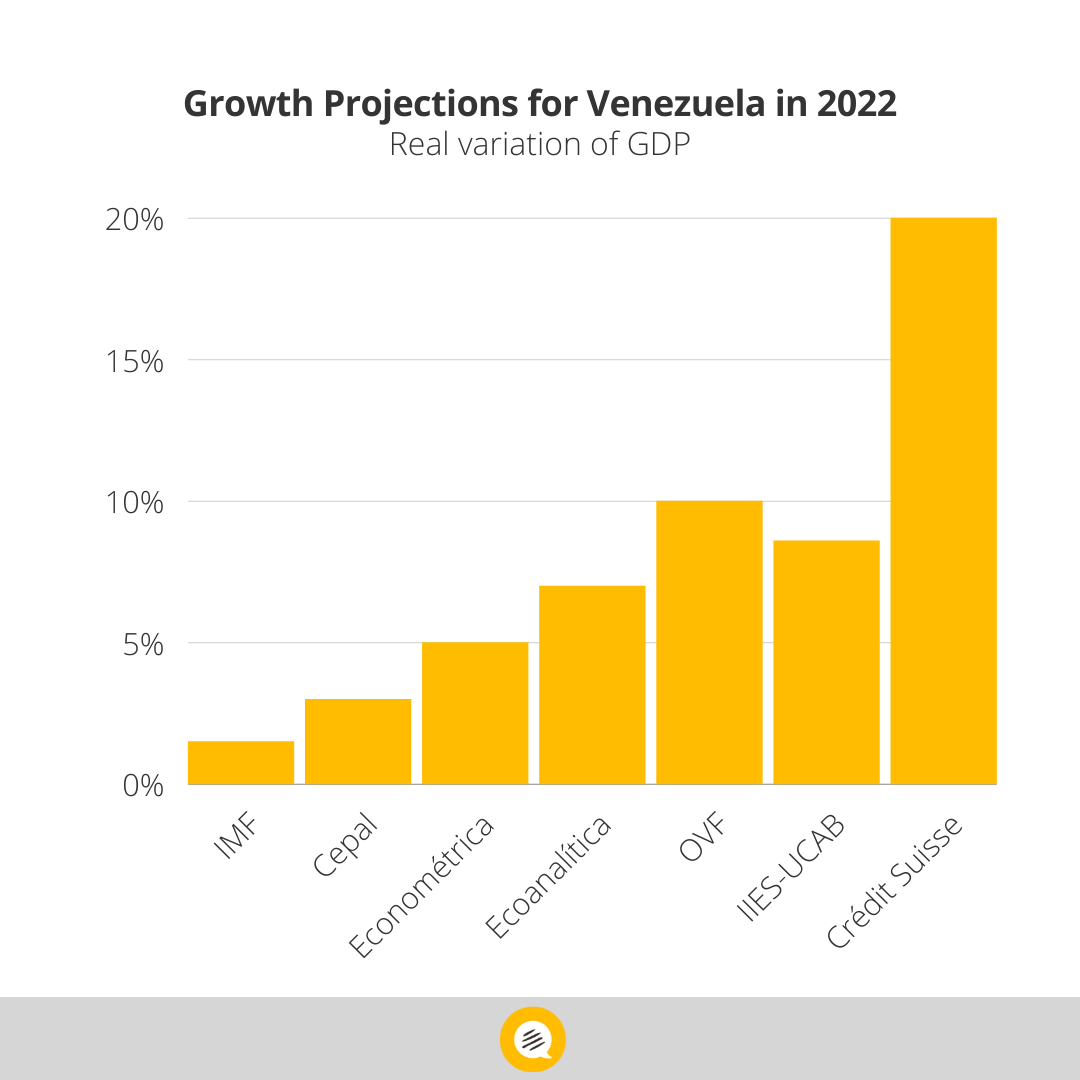
At the same time, the economic growth projection rates for 2022 presented so far show very big differences: the Comisión Económica para América Latina y el Caribe (CEPAL) considers it to be 3%, while Credit Suisse estimates it’s 20%.
If BCV is disguising macroeconomic numbers, it wouldn’t be the first time it’s happened in the public sector. Economist José Guerra, elected opposition representative for the 2015 National Assembly and member of the OVF, sustains that the three monetary conversions that have taken place during chavista administrations, which have removed 14 zeroes to the national currency in total, are but “accounting disguises” to cover up devaluation.
No GDP
The lack of transparency and the systematic murkiness in the macroeconomic numbers raise suspicion and mistrust. The Venezuelan State hasn’t released the Gross Domestic Product (GDP) since 2019, even though this is one of the main indicators for measuring economic health, and in spite of ending an eight-year recession. Not only the BCV is talking about a GDP increase.
It’s possible that now that the numbers have improved, the BCV will publish the GDP once again in the upcoming months, as it did with the National Consumer Price Index, the main indicator for evaluating inflation, as soon as the hyperinflation cycle ended (according to measurements in bolivars), which went from 2017 to 2021.
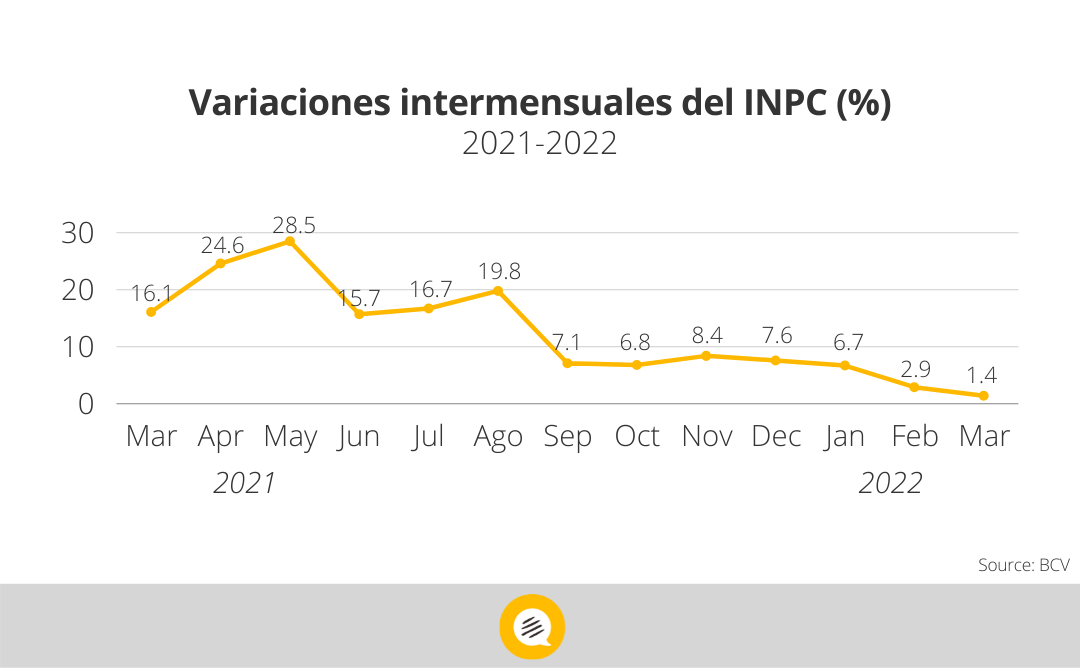
Month to month variation (%), National Consumer Price Index
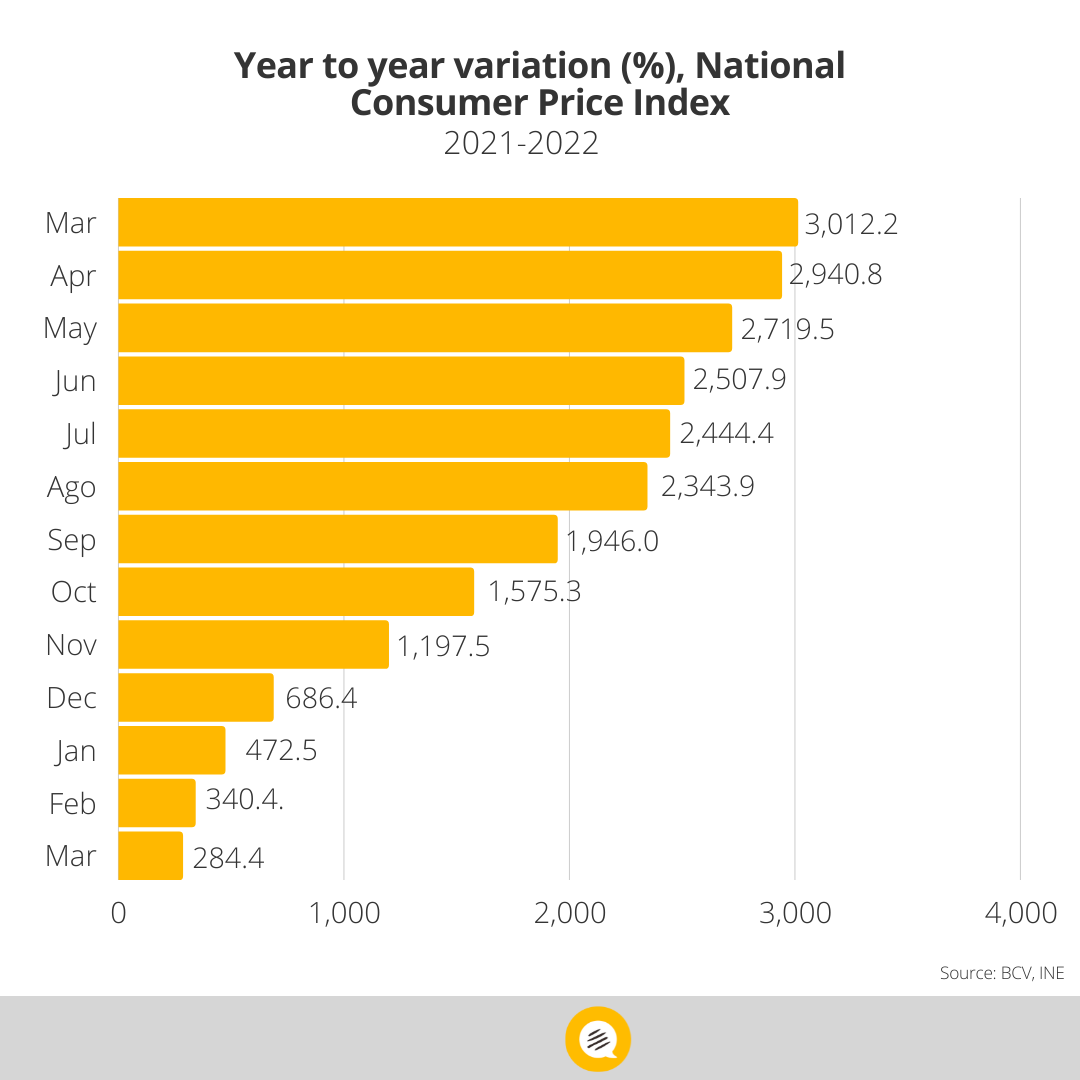
The BCV claims that in March 2022 Venezuela had the lowest inflation rate registered in the past 115 months, since 2012: 1.4%. But if you measure the inter-annual variation, comparing March 2021 with March 2022, the resulting inflation according to numbers by the government, is 284.4%. A number much closer to the one calculated by OVF: 250% year-to-year.
Personally, based on my experience as a consumer in Venezuela last March, my wallet felt a great impact. The price increase in food and medicine was, for me, much higher than the 1% and 0.5% the BCV reported in those categories. I feel that the number handled by OVF for those items (10.5%) is much closer to my family’s reality.
Whatever the real number is, the increasing prices for the consumer in March answers to many elements, among them the minimum wage raise announced by the government (from 1.5 dollars at the beginning of the year to 30 dollars last month, and adding much more circulating money into the system) and the enforcement of the reform of Impuesto de las Grandes Transferencias Financieras (IGTF) on March 28th.
We can also include the impact of the war in Ukraine on the prices of food worldwide, as it was reported by the Food and Agriculture Organization of the United Nations (FAO) a few days ago. Its global index on food reached its highest level in March in over 30 years: 159.3 points, a spike of 12.6% in relation to the start of the war, and 33.6% more than what was registered in March of 2021.
Therefore, an important inflation spike was foreseeable and justified, but the BCV swears that food in Venezuela (a great deal of it is imported, especially wheat) only had a 1% price increase.
Upcoming Scenarios
In any case, it will be in April when we’ll be able to measure the impact of that 3% from the ITGF more precisely. Fedecámaras, Conindustria, and Fedeagro estimate that the price increase will ultimately be around 10% and 15%.
Why? Because that tax has a “ripple” effect. In other words, not only those who carry out “large financial transactions” will pay the tax, as the law’s name falsely suggests, but anyone who uses foreign currency and crypto-currency besides the petro to pay in the different stages of the production and value chain of those goods and services.
So, if those who buy corn from the farmer use dollars (3%) and those who pay the driver taking the corn to the industrial silo (3%), and the guy who grinds the corn and turns it into packaged flour (3%), and the transport taking it to wholesalers (3%), and finally to the location for retail distribution (3%), in the end, it won’t be a 3% increase, but four or five times that 3%. In other words, 12% or 15% for the end consumer.
In addition, you have to consider that Maduro’s regime has been delaying payment of customs duties to many imported goods that have come into the country in the past four years without paying VAT or the required sanitary registries. Fedecámaras insists that that’s unfair competition against domestic products, and to solve this issue the government promised business owners last year to lift the exemptions to hundreds of duty lines to support Venezuelan-made products.
The new extension given to these exemptions expires at the end of April 2022 and, if the government doesn’t postpone it again, that can also accelerate inflation because the final price of those imported products will once again include the cost of the tariffs the importers have to pay.
How Are the Differences in Numbers Explained?
The differences between the GDP and inflation numbers in Venezuela that are being handled by the economic players can only be explained by the authors themselves.
That’s why economist Leonardo Vera, Doctor in Economy from East London University and Professor of Macroeconomics at the Universidad Central de Venezuela, suggests that these organizations publish their methodology to make the processes more transparent.
Furthermore, to follow up on Venezuela’s inflation, Vera suggests making better use of inter-annual rates instead of monthly rates.
During the inflation cycle, it was important to report the monthly variations because when the country maintains rates under 50% for 12 straight months, it’s technically out of hyperinflation. But now, the right thing is to go year-on-year. “Inflation rates tend to show too much variability,” Vera says. “
That’s why many countries, when they report inflation every month, they don’t report it month-by-month, but year-to-year. And if we use that data, we’ll see that inter-annual inflation rates from March by the BCV (284%) and OVF (250%) aren’t that different,” the macroeconomics expert says.
The difference in methodology and ponderations that exists between the data lifted from these institutions can also be notable, and in part explain the numeric inconsistencies in March.
“The geographic coverage used by the BCV to collect pricing data is much larger than the one used by OVF. Traditionally, when the BCV was more transparent, prices would be measured in Venezuela’s largest cities. For OVF, because of mobility problems and its limited resources, it’s likely that their coverage is smaller and that can cause important differences,” Vera explains.
Besides, if an institution is using information in bolivars, and the other is using dollars and then they convert it to bolivars using the day’s exchange rate (official or black market?), that can also result in different numbers.
Another element that could be causing these numerical inconsistencies between both institutions are the considerations in their methodology; in other words, the importance given to each category in their measured goods and services basket.
If the BCV registers prices every month across the country visiting local shops, but they’re using the weighting factor from ten years ago to do so, that coefficient is no good to accurately measure what they want to measure because the Venezuelan economy in 2012 was completely different to today’s. Ten years ago the category for “food and non-alcoholic beverages” could represent 20% of a Venezuelan family’s typical expenses, but in 2022 it represents a much higher number.
“You can also have differences between the baskets that both institutions take. Maybe the BCV has a very broad one, ranging from food and beverages, all the way to clothes, shoes, and other goods and services; and the one used by the OVF isn’t as diverse,” the economist added.
A country that has gone through four years of hyperinflation has to have radical changes in the consumer structure, especially in homes that have been impoverished.
Blindfolded
In general, the BCV doesn’t release fundamental economic numbers from Venezuela since March 2019: nor the GDP, industrial production, commercial flow or sales, or payment balances.
“They’re taking national statistics for political use,” José Guerra points out. “The OVF, since 2017, started filling that information void and publishing those indicators: inflation, and later an economic activity indicator which simulated the GDP. Our numbers covered the absence of the BCV until last year, when they resumed issuing inflation rates.”
Inflation rates by both BCV and OVF are the same in terms of tendencies, first increasing in a very steep manner from 2017 to 2020, and then decreasing after mid-2021. “What changes is the intensity in the decrease. BCV gets 1.4% in March and we get 10.5%, but before that, we used to get lower numbers than they did,” Guerra says.
That change in tendency is also very rare. One of three things happened: or they changed their methodology in March, or the coefficients, or they’re counting things that they didn’t count the same way before.
“What’s going on there? No one knows. The ponderations used by the BCV are unknown. I’m afraid that they’re including the prices of the CLAP bags in their baskets, which will give the numbers an important tilt to the low end,” Guerra concludes.
Caracas Chronicles is 100% reader-supported.
We’ve been able to hang on for 22 years in one of the craziest media landscapes in the world. We’ve seen different media outlets in Venezuela (and abroad) closing shop, something we’re looking to avoid at all costs. Your collaboration goes a long way in helping us weather the storm.
Donate